

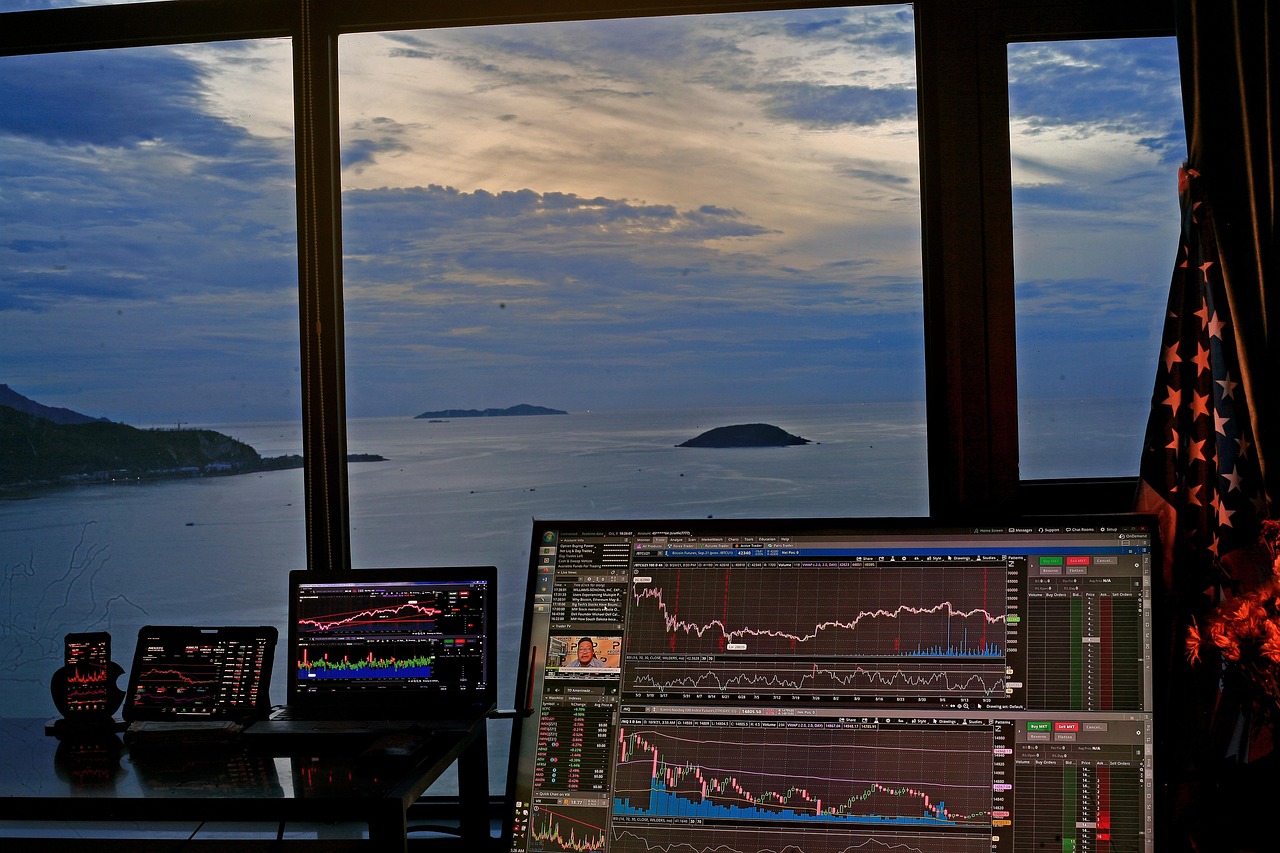
Crypto prices swing fast, and emotions often drive those swings. If you want to understand market mood, you need to know how to use a crypto fear and greed index. This simple tool turns complex sentiment data into one easy number. Used well, it helps you stay calm when others panic.
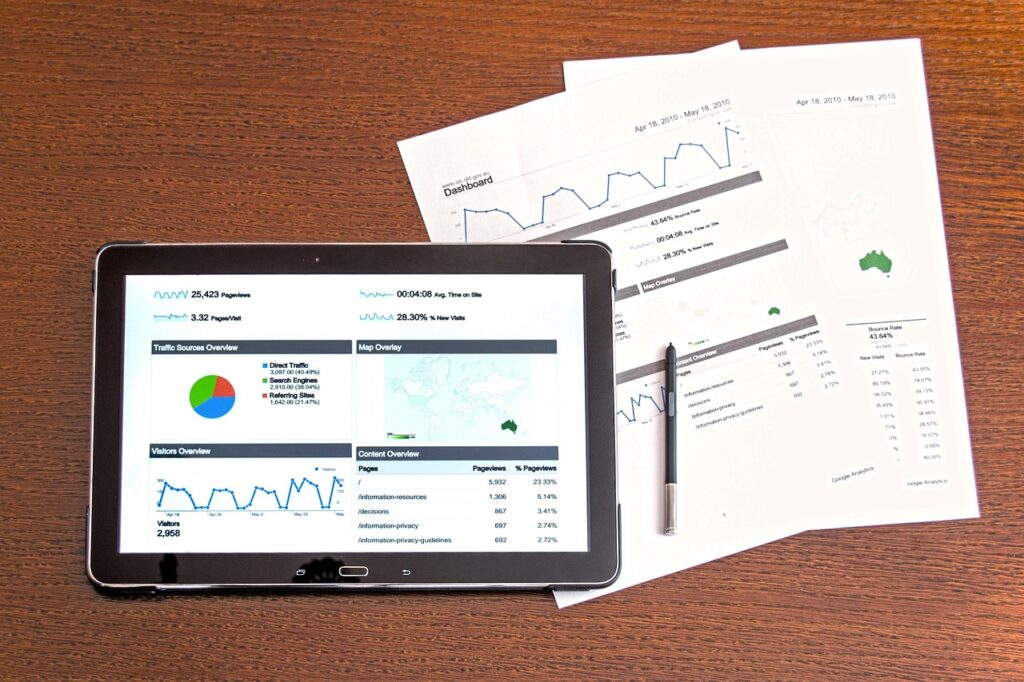
What Is a Crypto Fear and Greed Index?
A fear and greed index measures the overall emotional state of the crypto market. It usually produces a score from 0 to 100. A low score signals extreme fear, while a high score signals extreme greed.
The idea is simple. When investors feel terrified, they often sell too cheaply. When they feel euphoric, they often buy at inflated prices. The index highlights these emotional extremes so you can spot them early.
What Data Feeds the Index?
Most indexes combine several signals into a single score. Each signal captures a different side of investor behavior. Together, they paint a broader picture than price alone.
- Volatility: sharp price swings often point to fear.
- Market momentum and volume: strong buying pressure suggests greed.
- Social media activity: surges in posts and hashtags reveal growing excitement.
- Surveys and search trends: rising searches for crashes or rallies reflect public mood.
- Bitcoin dominance: a rising share often shows investors seeking safety.
Different providers weigh these factors differently. Therefore, always check how your chosen index calculates its score.
How to Read the Score Step by Step
Reading the index takes only a few minutes. However, reading it well requires context. Follow a simple routine to avoid common mistakes.
Understand the Score Ranges
Scores from 0 to 25 usually mean extreme fear. Scores from 26 to 45 show fear, and 46 to 55 indicate a neutral market. Scores from 56 to 75 signal greed, and anything above 75 suggests extreme greed.
Look at the Trend, Not Just Today’s Number
A single reading tells you little. Instead, compare today’s score with last week and last month. A slow climb from fear to neutral often says more than one dramatic jump.
How to Use a Crypto Fear and Greed Index in Your Strategy
The index works best as a contrarian signal. Famous investors often say to be fearful when others are greedy. They also say to be greedy when others are fearful.
For example, an extreme fear reading may mark a good moment to research long-term buys. Conversely, extreme greed may be a cue to take profits or tighten your risk limits. In both cases, the index prompts you to pause and think.
Additionally, many investors pair the index with dollar-cost averaging. This method spreads purchases over time, which reduces the pressure to time the market. The index then acts as a gentle check on your emotions rather than a trigger.
Common Mistakes to Avoid
Many beginners treat the index as a crystal ball. It is not one. Markets can stay fearful or greedy far longer than you expect.
- Do not buy or sell based on the score alone.
- Do not ignore fundamentals, such as project quality and regulation.
- Do not check the index obsessively every hour.
- Do not risk money you cannot afford to lose.
Instead, combine the index with technical analysis, news, and your own risk tolerance. This layered approach gives you far stronger footing.
Limitations You Should Know
No sentiment tool is perfect. Social media data can be manipulated by bots and hype campaigns. Moreover, the index reflects mostly Bitcoin and large-cap coins, so smaller tokens may behave differently.
Timing also matters. The index looks backward at recent behavior, so it can lag sudden news events. As a result, treat it as one input among many.
Frequently Asked Questions
How often is the index updated?
Most popular indexes update once every 24 hours. Some providers offer more frequent updates for active traders.
Can the index predict price crashes?
No, it cannot predict the future. It only shows current sentiment, which sometimes precedes reversals but never guarantees them.
Is the index useful for long-term investors?
Yes, it can help long-term investors avoid panic selling and impulsive buying. It works as a reminder to stick with a plan.
Is the index free to use?
Yes, several well-known versions are free and available online. You can check them in seconds with no signup.
Conclusion
A fear and greed index will not make you rich overnight, but it can make you more disciplined. It reveals when emotions run high, which is exactly when mistakes happen. Start by checking it weekly, compare it with your own research, and build a routine you trust. Over time, that calm approach may prove more valuable than any single trade.
 100Ethereums - Your Guide to Ethereum, Crypto & Blockchain