

Crypto markets move fast, and the numbers on your screen can feel overwhelming. Learning how to read crypto market data helps you separate useful signals from noise. This guide walks you through the key metrics every beginner should understand.
You do not need a finance degree to get started. You only need a clear framework and a little practice.
Start With Price and Market Capitalization
Price is the first number most people see. However, price alone says very little about the size or strength of a project. A coin priced at $0.01 is not automatically cheaper than one priced at $1,000.
Market capitalization gives you better context. It equals the current price multiplied by the circulating supply. As a result, it shows how much total value the market assigns to a coin.
Analysts often group coins by market cap:
- Large cap: established assets such as Bitcoin and Ethereum, usually less volatile.
- Mid cap: growing projects with moderate risk.
- Small cap: newer or niche coins with high potential and high risk.
Understand Trading Volume
Trading volume measures how much of an asset changed hands during a set period, usually 24 hours. High volume suggests strong interest and easier trading. Low volume can signal thin markets where small orders move prices sharply.
Volume also helps you confirm price moves. For example, a price jump on heavy volume is more convincing than one on light volume. Therefore, always check both numbers together.
Be careful with volume figures on unfamiliar exchanges. Some platforms inflate their numbers through wash trading. Stick with reputable data aggregators when possible.
How to Read Crypto Market Data on Price Charts
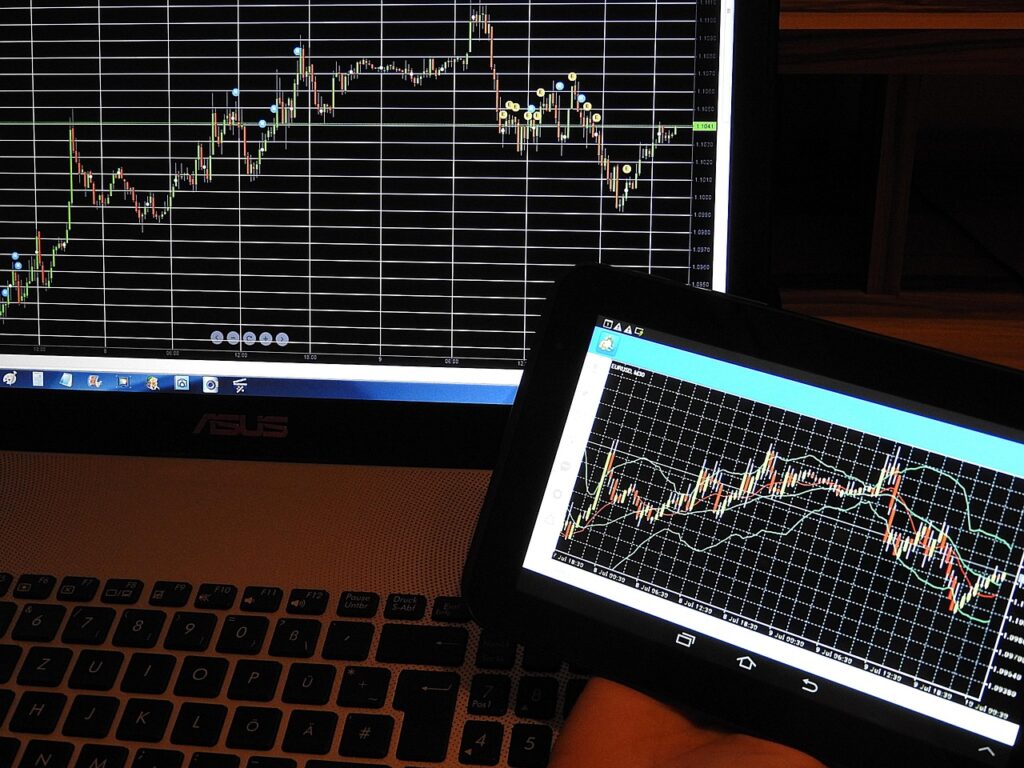
Charts turn raw numbers into patterns. Most platforms display candlestick charts, where each candle represents a time period. The body shows the opening and closing prices, while the thin lines show the highs and lows.
A green candle usually means the price closed higher than it opened. A red candle means the opposite. Longer candles reflect bigger moves, and long wicks suggest the price was rejected at certain levels.
Timeframes matter as well. A one-minute chart shows short-term noise, while a daily or weekly chart reveals the broader trend. Consequently, zooming out often gives you a calmer and more useful picture.
Support and Resistance
Support is a price level where buyers tend to step in. Resistance is a level where sellers often appear. Traders watch these zones because prices frequently pause or reverse near them.
Moving Averages
A moving average smooths out price swings by averaging recent prices. The 50-day and 200-day averages are popular choices. When the price sits above a long-term average, the trend is generally considered healthy.
Look at the Order Book and Liquidity
The order book lists all open buy and sell orders on an exchange. Buy orders are called bids, and sell orders are called asks. The gap between the highest bid and the lowest ask is the spread.
A narrow spread and deep order book indicate good liquidity. In other words, you can buy or sell without moving the price much. A wide spread warns of higher trading costs and slippage.
Check Supply and On-Chain Metrics
Supply data tells you how many coins exist and how many are available. Circulating supply counts coins currently in the market. Total supply includes coins that may be locked or not yet released.
On-chain metrics add another layer. They come directly from the blockchain rather than from exchanges. Useful examples include:
- Active addresses, which show network usage.
- Transaction counts, which reflect real activity.
- Exchange inflows and outflows, which hint at buying or selling pressure.
Combine Data With Market Sentiment
Numbers do not tell the whole story. Sentiment indicators, such as the Fear and Greed Index, show how emotional the market currently feels. Extreme greed can precede corrections, while extreme fear sometimes marks buying opportunities.
Still, no single indicator works alone. For example, rising volume, a strong trend, and positive on-chain activity together build a more reliable case than any one signal.
Frequently Asked Questions
Which crypto metric should beginners learn first?
Start with price, market cap, and trading volume. These three numbers give you a quick snapshot of any coin’s size and activity.
Where can I find reliable crypto market data?
Well-known aggregators like CoinMarketCap and CoinGecko are popular starting points. For deeper analysis, blockchain explorers and on-chain analytics platforms add useful detail.
Can market data predict future prices?
No, data cannot guarantee future results. It helps you understand current conditions and manage risk, but surprises still happen.
Final Thoughts
Reading crypto data becomes easier once you know which numbers matter. Focus on price, market cap, volume, charts, liquidity, and on-chain activity, and always view them together. Practice on a few well-known coins, and keep learning as the market evolves.
 100Ethereums - Your Guide to Ethereum, Crypto & Blockchain