

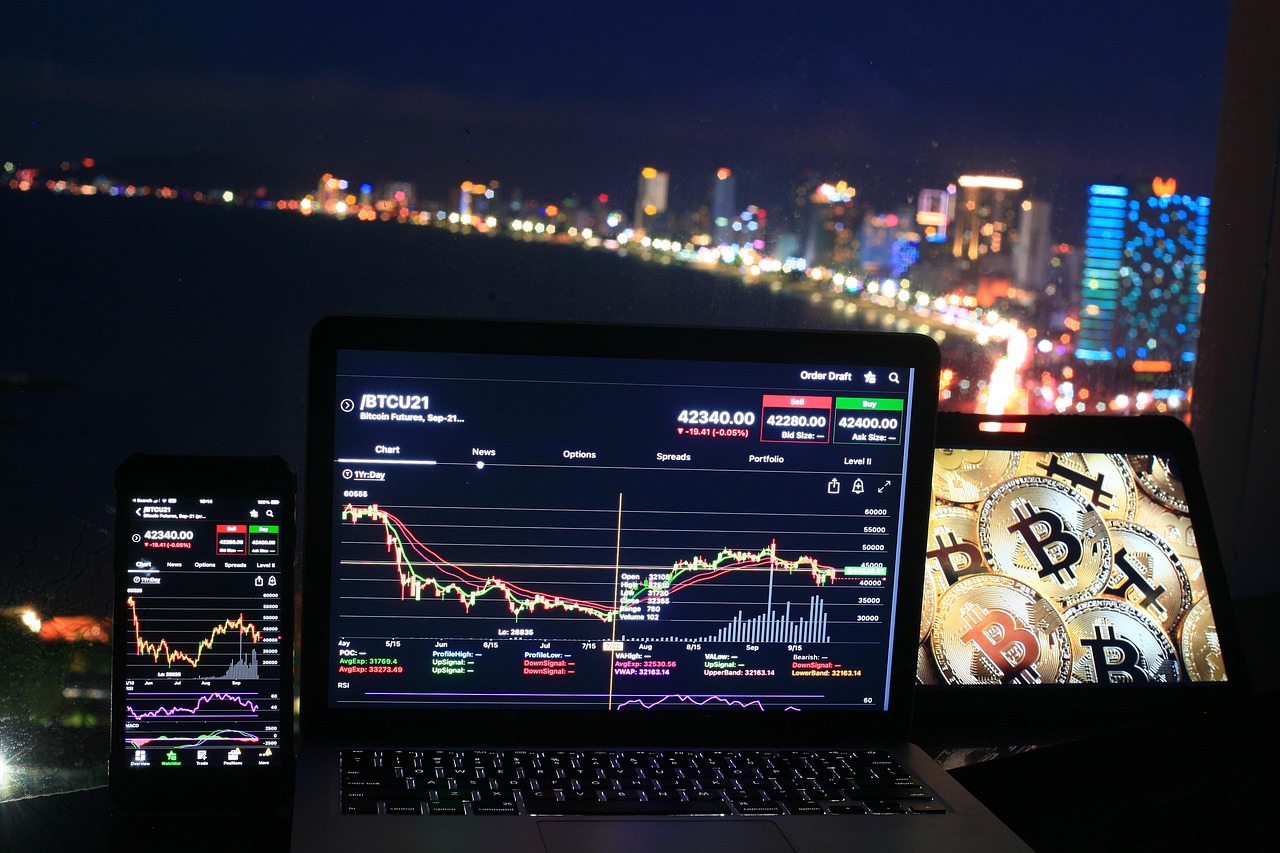
What is cryptocurrency volume? Simply put, it measures how much of a coin has been traded over a specific period. This number tells you how active a market really is. Traders and investors watch it closely before making any decision.
Understanding What Cryptocurrency Volume Means
Cryptocurrency volume represents the total amount of a coin bought and sold within a given timeframe, usually 24 hours. It’s typically measured in the coin’s own units or in dollar value. For example, if a million coins change hands in a day, that’s the daily volume.
This metric applies to every exchange and every trading pair. As a result, you can compare volume across different platforms. Higher numbers generally mean more people are actively trading that asset.
Why Trading Volume Matters So Much
Volume reveals the true strength behind a price movement. If a coin’s price rises but volume stays low, the rally might not last. On the other hand, a price increase backed by high volume often signals genuine market interest.
Additionally, volume helps confirm trends. Traders use it to separate real momentum from temporary noise. Without checking volume, price charts alone can be misleading.
Key Benefits of Watching Volume
- Confirms whether a price trend is strong or weak
- Highlights liquidity, showing how easily you can buy or sell
- Signals potential reversals when volume spikes suddenly
- Helps spot fake breakouts with little real trading behind them
How Volume Relates to Liquidity
Liquidity describes how easily an asset can be traded without affecting its price. Cryptocurrency volume is directly tied to this concept. A coin with high volume usually has better liquidity, meaning you can enter or exit a position quickly.
Therefore, low-volume coins can be risky. Prices may swing wildly from just a few large trades. This makes them harder to trade safely, especially for beginners.
Reading Volume Alongside Price Charts
Most trading platforms display volume as a bar chart below the price chart. Each bar shows the amount traded during that period. For example, tall bars during a price surge suggest strong buying pressure.
Meanwhile, shrinking volume during a price increase can be a warning sign. It often means the trend is losing steam. Combining volume with price action gives a clearer picture than price alone.
Common Volume Patterns to Recognize
- Rising price with rising volume: a healthy, confirmed uptrend
- Rising price with falling volume: a potential weakening trend
- Sudden volume spikes: often linked to news or major events
- Consistently low volume: a sign of limited market interest
Where to Check Cryptocurrency Volume
Most major exchanges display volume directly on their trading pages. Additionally, market data websites aggregate volume across multiple exchanges. This gives a broader view of overall market activity for any given coin.
It’s worth noting that reported volume isn’t always accurate. Some exchanges have been known to inflate their numbers. As a result, comparing data across several trusted sources is a smart habit.
Frequently Asked Questions
What is a good trading volume for a cryptocurrency?
There’s no fixed number, but coins with millions of dollars in daily volume are generally considered liquid and actively traded. Compare volume relative to the coin’s market cap for better context.
Does high volume mean the price will go up?
Not necessarily. High volume simply shows strong trading activity, which can accompany price increases or decreases. It confirms momentum rather than predicting direction.
Can trading volume be manipulated?
Yes, some exchanges or traders use wash trading to inflate reported volume artificially. That’s why checking data from multiple reputable sources is important.
How often does volume data update?
On most exchanges and tracking sites, volume updates in real time or every few minutes. Daily volume figures typically reset every 24 hours.
Final Thoughts
Understanding cryptocurrency volume gives you a clearer view of market activity beyond just price. It helps confirm trends, assess liquidity, and avoid risky, thinly traded coins. Next time you check a chart, take a moment to look at the volume too.
 100Ethereums - Your Guide to Ethereum, Crypto & Blockchain