

Crypto markets move fast, and charts can look confusing at first glance. Knowing how to read a crypto price chart helps you understand what the market is doing. This guide breaks the process into simple, practical steps.
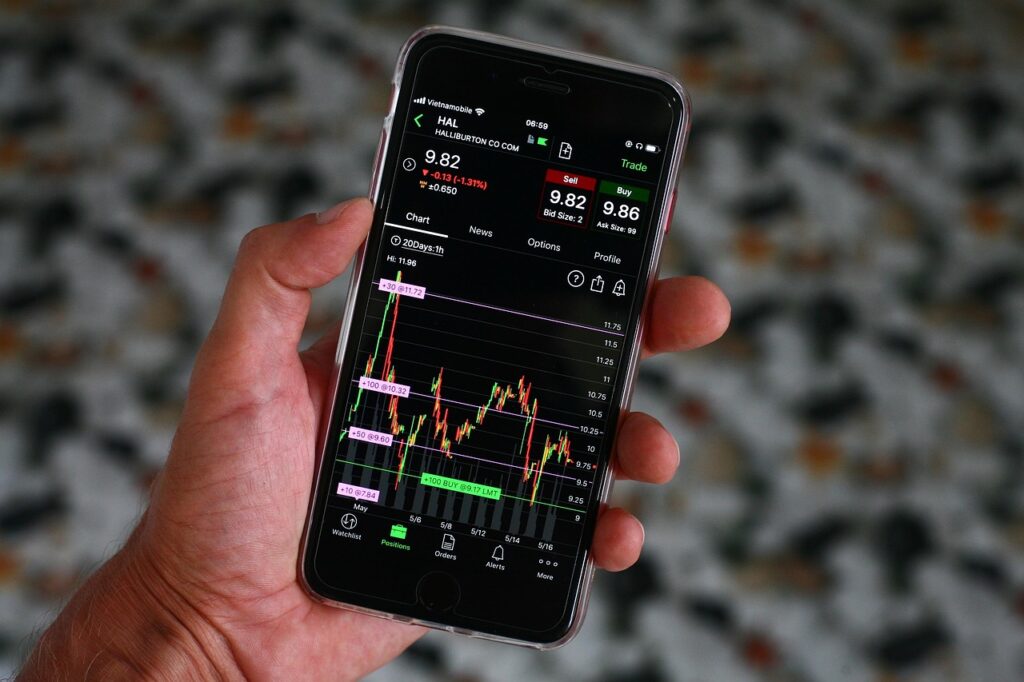
You do not need a finance degree to get started. Instead, you need a handful of core concepts and some patience. Let’s walk through them one at a time.
Start With the Basics of a Price Chart
Every chart shows price on the vertical axis and time on the horizontal axis. Price changes appear as a line, bars, or candles. Most traders prefer candles because they show more information at once.
Before anything else, pick your timeframe. A one-minute chart suits very short-term trading. On the other hand, a daily or weekly chart reveals the bigger picture and filters out noise.
Understand Candlestick Patterns
A candlestick shows four prices for a chosen period: open, high, low, and close. The thick part is the body, and the thin lines are the wicks. Green candles usually mean the price closed higher than it opened, while red candles mean the opposite.
Long wicks tell an important story. For example, a long upper wick shows that buyers pushed the price up, but sellers pushed it back down. Therefore, wicks often signal hesitation or a possible reversal.
Common Candle Shapes to Know
- Doji: The open and close are nearly equal, which signals indecision.
- Hammer: A small body with a long lower wick, often seen near bottoms.
- Shooting star: A small body with a long upper wick, often seen near tops.
- Engulfing candle: A large candle that covers the previous one, hinting at a momentum shift.
No single candle predicts the future. Rather, treat each one as a clue that needs confirmation from other signals.
Read Support, Resistance, and Trends
Support is a price level where buyers tend to step in and stop a decline. Resistance is a level where sellers tend to appear and stop a rise. Together, these levels form the boundaries of many price moves.
Trends add more context. An uptrend makes higher highs and higher lows, whereas a downtrend makes lower highs and lower lows. Drawing simple trendlines helps you see this structure clearly.
When price breaks through a key level, traders pay close attention. However, many breakouts fail, so wait for confirmation before acting on one.
Use Volume to Confirm Price Moves
Volume shows how much of an asset traded during a period. It usually appears as bars at the bottom of the chart. High volume means strong participation, so it adds weight to a price move.
Consider a breakout above resistance on heavy volume. That move is more convincing than the same breakout on thin volume. Likewise, a price drop on rising volume suggests real selling pressure.
Add Simple Indicators to Your Crypto Price Chart
Indicators are calculations drawn on top of or below the chart. They help you measure momentum and trend strength. Start with just a few so that your screen stays clean.
Moving Averages
A moving average smooths price data into a single line. The 50-day and 200-day averages are popular choices. When price sits above these lines, the trend is generally healthy.
Relative Strength Index
The RSI moves between 0 and 100. Readings above 70 suggest an asset may be overbought, while readings below 30 suggest it may be oversold. As a result, many traders use it to spot potential turning points.
MACD
The MACD compares two moving averages to show momentum shifts. When its two lines cross, it can hint at a change in direction. Use it alongside price action, not in place of it.
Avoid Common Chart-Reading Mistakes
Beginners often make the same errors. Fortunately, you can avoid most of them with a little discipline.
- Using too many indicators at once, which creates conflicting signals.
- Ignoring higher timeframes and focusing only on short-term noise.
- Treating patterns as guarantees instead of probabilities.
- Trading without a plan for entries, exits, and risk.
Moreover, remember that news and sentiment can override any technical setup. Crypto is volatile, so manage your risk carefully and never invest more than you can afford to lose.
Frequently Asked Questions
What is the best timeframe for beginners?
Daily charts are a good starting point. They show clear trends and reduce the noise found on shorter timeframes.
Can charts predict crypto prices accurately?
No, charts cannot predict prices with certainty. They help you assess probabilities and manage risk.
Which indicators should I learn first?
Begin with volume, moving averages, and the RSI. Together, they cover trend, strength, and momentum.
Are candlestick charts better than line charts?
Candlesticks show open, high, low, and close, so they contain more detail. Line charts, however, work well for a quick overview.
Final Thoughts
Learning how to read a crypto price chart takes practice, but the basics are quite manageable. Focus on candles, levels, trends, and volume first, then add indicators slowly. Open a demo account or a charting tool today and practice on real market data without risking a cent.
 100Ethereums - Your Guide to Ethereum, Crypto & Blockchain